Order flow that remembers: a Hawkes-driven limit order book
A synthetic limit order book driven by a six-kind Hawkes process, simulated exactly in your browser at about 300 events a second and drawn as terrain. Most market orders are set off by earlier ones; Fig. 2 shows what set off any one.

| Bid | Shares waiting to buy | Ask | Shares waiting to sell |
|---|---|---|---|
| $100.18 | 54 shares | $100.19 | 22 shares |
| $100.17 | 87 shares | $100.20 | 65 shares |
| $100.16 | 20 shares | $100.21 | 17 shares |
| $100.15 | 23 shares | $100.22 | 23 shares |
| $100.14 | 80 shares | $100.23 | 68 shares |
What you are looking at
A limit order book is a market’s list of people waiting to trade. At every price there is a queue: buyers bidding below the last trade, sellers asking above it. The two best prices, the highest bid and the lowest ask, are the touch, and the gap between them is the spread.
In Fig. 1 that list is a landscape. Across the valley runs price, bids to the left and asks to the right; the height of a wall at a price is every share waiting between the touch and that price, so the walls rise away from the spread. Twelve times a simulated second the book is photographed into one ridge, and the ridges recede into the page, the newest at the front, as far back as twenty-one seconds where the device draws them all. The line along the valley floor is the mid-price; each spark is a trade, a market order taking a queue at the touch.
The model
Six kinds of order arrive: limit buys and sells, market buys and sells, and a cancellation on each side. Each arrives as one component of a multivariate Hawkes process, whose intensity is its baseline plus a decaying lift from every earlier event:λi(t) = μi + Σj Σtk < t aij e−βj(t − tk).That is how real order flow behaves: a market buy makes another likelier, liquidity that was taken refills, and a new limit order is often soon cancelled.
The branching matrix Bij = aij/βj counts the events of kind i one event of kind j sets off directly. Its spectral radius, the branching ratio, is 0.52: below one, so the process is stationary, and its long-run rates are (I − B)−1μ, 300.1 events a second in all. Events are drawn exactly, by Ogata’s thinning: between events every intensity only decays, so the intensity now bounds it until the next event, and a candidate drawn at that bound is kept with probability λ(t)/λ*.
Which earlier order set off a given one is never observed, only probable. Just before an order, its intensity is its baseline plus one decaying term for each earlier order; each term’s share of the total is the probability that that order was its parent, and the baseline’s share is the chance it came on its own. Fig. 2 draws the flow the terrain is built from, and reads what set off any order you choose, by the kind of earlier order.
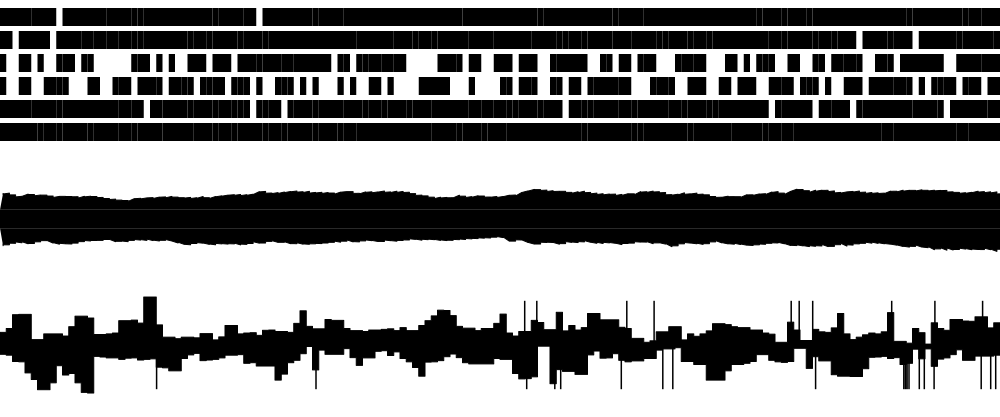
| Seconds before the still frame | Order | Price | Shares | Set off by, by kind of earlier order | On its own |
|---|---|---|---|---|---|
| 0.008 | limit sell | $100.25 | 34 shares | limit sells 18.7%, market buys 15.8%, cancelled asks 6.9%, market sells 3.2% | 55.4% |
| 0.010 | limit buy | $100.17 | 15 shares | limit buys 18.1%, market sells 10.3%, cancelled bids 7.1%, market buys 5.6% | 58.9% |
| 0.012 | limit buy | $100.14 | 40 shares | limit buys 17.5%, market sells 10.4%, cancelled bids 7.2%, market buys 5.7% | 59.2% |
| 0.013 | cancelled bid | $100.08 | 11 shares | limit buys 34.1%, cancelled bids 10.0%, market sells 5.0% | 50.9% |
| 0.014 | limit buy | $100.16 | 5 shares | limit buys 17.0%, market sells 10.5%, cancelled bids 6.9%, market buys 5.8% | 59.8% |
| 0.015 | limit sell | $100.49 | 18 shares | limit sells 18.3%, market buys 16.0%, cancelled asks 7.0%, market sells 3.2% | 55.4% |
| 0.016 | cancelled ask | $100.36 | 12 shares | limit sells 35.4%, cancelled asks 9.6%, market buys 7.7% | 47.3% |
| 0.028 | limit buy | $100.18 | 39 shares | limit buys 16.9%, market sells 10.7%, cancelled bids 7.2%, market buys 5.9% | 59.4% |
| 0.028 | limit sell | $100.23 | 6 shares | limit sells 18.3%, market buys 16.4%, cancelled asks 6.9%, market sells 3.3% | 55.2% |
| 0.031 | limit buy | $100.18 | 15 shares | limit buys 16.3%, market sells 10.8%, cancelled bids 7.3%, market buys 5.9% | 59.6% |
| 0.037 | cancelled ask | $100.29 | 8 shares | limit sells 35.8%, cancelled asks 9.6%, market buys 8.0% | 46.6% |
| 0.041 | market buy | $100.19 | 2 shares | market buys 48.2%, cancelled asks 17.8%, market sells 4.5% | 29.6% |
| 0.042 | limit buy | $100.14 | 11 shares | limit buys 16.1%, market sells 11.1%, cancelled bids 7.5%, market buys 5.7% | 59.6% |
| 0.043 | market buy | $100.18 | 13 shares | market buys 46.4%, cancelled asks 18.4%, market sells 4.6% | 30.5% |
| 0.046 | limit sell | $100.51 | 2 shares | limit sells 18.7%, market buys 15.0%, cancelled asks 7.0%, market sells 3.5% | 55.8% |
| 0.047 | limit buy | $99.99 | 23 shares | limit buys 15.7%, market sells 11.3%, cancelled bids 7.7%, market buys 5.4% | 60.0% |
| 0.050 | limit sell | $100.18 | 4 shares | limit sells 18.3%, market buys 15.2%, cancelled asks 7.1%, market sells 3.5% | 55.9% |
| 0.052 | market sell | $100.17 | 2 shares | market sells 34.3%, cancelled bids 22.5%, market buys 7.8% | 35.4% |
| 0.055 | cancelled bid | $99.71 | 2 shares | limit buys 31.6%, cancelled bids 11.1%, market sells 5.0% | 52.3% |
| 0.057 | limit buy | $100.17 | 21 shares | limit buys 15.6%, market sells 10.4%, cancelled bids 7.6%, market buys 5.6% | 60.8% |
The book
Orders land in a price-level book. A limit order joins a queue at a power-law distance from the touch, or improves the price when the spread is wide; a market order walks the other side level by level, trading at each; a cancellation takes part of one queue, chosen in proportion to its size, which is what keeps the book’s depth stationary instead of growing without bound.
It is calibrated to look like a busy stock opened at $100.00. Measured over ten simulated minutes on the seed Fig. 1 draws: 301.2 events a second, a realised volatility of 26.3% a year (one-second returns of the mid, over 252 trading days of 6.5 hours), and a spread of one or two ticks 99.8% of the time.
One market, in every browser
The server runs the seeded market to the moment the still frame shows; your browser runs the same seed to the same moment and carries on from there. For those to be one market, two things that browsers usually leave to chance are fixed. The clock moves in whole quanta of 1/60 of a simulated second, so a 60 Hz screen and a 144 Hz one draw the same order flow. And the market computes its own exponentials and logarithms, from IEEE arithmetic alone, because engines may round Math.exp differently in the last bit, and one bit in a decay grows into a different market within seconds. A fingerprint of the market twenty seconds after the still frame is pinned in the tests, and Chromium, WebKit and Firefox each reach it exactly; with ?debug=1 the figure shows whether your browser does.
How it is tested
- Time rescaling: if the simulation is exact, each kind’s intensity integrated between its events is exponential with mean one. A Kolmogorov–Smirnov test holds that for every kind and for all of them together, over five seeds, each family (per kind, and pooled) at a 1% family-wise level; the intensity it integrates is rebuilt from the event times and the model alone, so a simulation that drifted from the model would fail it.
- Over ten seeds: the event rate, the realised volatility and the spread stay in the calm market’s range.
- The share of events that arrive on their own, not set off by another, matches Σμ over the stationary total.
- The book never crosses, no queue goes negative, and every market order fills at the touch of its moment, over a million events.
- Six hundred single steps are the same market as ten one-second ones, and the still frame followed by the live run is one straight run.
- The market’s exponential and logarithm agree with the platform’s to within two units in the last place.
- Chromium, WebKit and Firefox each run the seeded market to the fingerprint Node pins.
- Fig. 2 draws each market order’s intensity exactly: just before every one, it equals the model’s intensity rebuilt from the event times alone, to a billionth. What set an order off, by kind, and the chance it came on its own add up to one.
- synthetic; parameters set by hand
- Hawkes, Spectra of some self-exciting and mutually exciting point processes, Biometrika 58(1), 1971 · Ogata, On Lewis’ simulation method for point processes, IEEE Transactions on Information Theory 27(1), 1981 · Bacry, Mastromatteo and Muzy, Hawkes processes in finance, Market Microstructure and Liquidity 1(1), 2015